
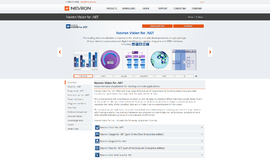
Nevron Chart for .NET
by Nevron Software LLC
The industry leading charting and gauge components for .NET
Helps with:
Controls,Reporting
Source Type:
Closed
License Types:
Supported OS:
Languages:
CS
VB.NET
What is it all about?
Nevron Chart for .NET combines visual richness with a vast amount of charting and gauge types grouped together in a comprehensible and extensible API. With advanced AJAX support, VS design time support and a payload of useful features Nevron Chart for .NET is the only complete component for building rich presentational, financial, scientific and business dashboards for WinForm and WebForm deployment.
Video & Images
Images
Key Features
Nevron Chart for .NET is designed to be flexible, efficient and extensible. Combining a vast amount of features in an intuitive and straightforward programming model, the component can display virtually any 2D or 3D chart including: Bar, Line, Step Line, Area, Pie, Point, Bubble, Stock, Floating Bar, Radar, Polar, High Low, Mesh Surface, Grid Surface, Shape, Smooth Line, Float Bar, Venn and Error with many variations (such as Scatter XY and XYZ Line, Stacked Bars, etc.). Other charting features include scrollable axes, integrated legend, chart annotations, watermarks and very extensible chart layout manager. The component also features full AJAX support and Visual Studio design time support with many advanced features such as style editors, allowing you to quickly modify the chart through the visual interface only. The control includes as well and a custom toolbar plus an integrated data grid components, which can come handy in advanced charting applications requiring high degrees of interactivity features.
Pricing
Yearly
Monthly
Lifetime
Free
Freemium
Trial With Card
Trial No Card
By Quote
Description
Community Edition available
Plans
Lifetime pricing starting at $0 for 1 Users


Top DiscoverSDK Experts


Jeamar Paul Libres
Software Engineer, Web Developer, Android Developer
GUI | Web and 15 more
View Profile

Interested in becoming a DiscoverSDK Expert? Learn more
X
Compare Products
Select up to three two products to compare by clicking on the compare icon () of each product.
{{compareToolModel.Error}}Now comparing:
{{product.ProductName | createSubstring:25}} X