Sponsors


Debugging Angular 2 Applications Using Chrome DevTools and Augury
Sorting out errors through Debugging in AngularJS 2.
There are times when you need to find out what is wrong with your code, or what specific part of your application is causing the problem, so that you can resolve your issues right away. Debugging has been part of us since we understand how to program an application, as it highlights the specific line of code where the crash happens or the logical error appears.
Usually, front-end developers see the HTML code through “Inspect Element” feature in most web browsers, which show the final HTML code (after all the transformation of PHP code and other non-HTML code to HTML), so the developers can modify certain values to see the changes, for instance, you can change the CSS styling of certain elements to test new properties, kind of using the tool to see the results in real-time, and then finally adding the change to the original HTML code.
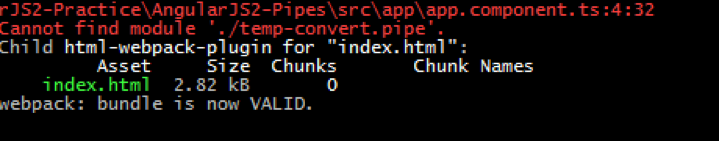
AngularJS 2 uses TypeScript which transpiles to JavaScript. If the errors appear on the TypeScript side (i.e., programming side), then syntax errors will show up on the console screen, so you can easily fix the language/syntax issues, but if something happens on the JavaScript side, then it may seem difficult for you to sort out the errors, let alone finding them through the console screen.
Fortunately, there are some tools available that allow the JavaScript (or even the TypeScript) code debugging, so if the console does not show any errors and the program is still “Loading…”, then you can check those errors through those tools. Two of the famous tools are Chrome DevTools and Augury—which are both integrated in Google Chrome browser.
So, I am going to highlight how to do debugging in Chrome DevTools and Augury. Let’s get started!
Debugging the AngularJS 2 Applications – Using Chrome DevTools and Augury
As AngularJS 2 uses the TypeScript as the official language, you can see the language or syntax errors on your console screen.
But, for the JavaScript side error (that is run on the browser after transpiling from TypeScript) or for general DOM manipulation, you can’t rely on the console. Fortunately, there are tools for that which uses the source maps for allowing the debugging in other languages. If you are not aware of source maps, then just know that it maps a combined or minified file back to the original or unbuilt state. So, if you query a specific line, then it will take you to the original file with the same equivalent line. Basically, it’s the only way to do debugging of the original TypeScript code (or any language that transpiles to JavaScript).
We will be using the Google Chrome browser for the debugging, so make sure you are not using Firefox or any other browser but Chrome. Let’s create a new project:
$ng new AngularJS2-Debugging
Via DevTools
Google DevTools is provided by default in Chrome browser. These are the tools that you see when you click on “Inspect Element”. Even though other browsers like Mozilla Firefox also support debugging tools, they are not as sophisticated as the Google DevTools.
Using the previous project, when you “ng serve”, you can see the “app works!” on the browser (which is the simplest program!). Now, right-click anywhere on the screen, and then go to “Inspect Element”. You will see several options here, but we are going to look at the “Source” screen at this moment.
Make sure the “sourceMap” is set to “true” in “tsconfig.json” of your project.
The “Source” enables you to see the ID of the element, which you can use in the “Console” tab for fetching the DOM element, and manipulating it accordingly. So, if an element has the ID of “$0”, you can get the element by writing it down on the console:
$0
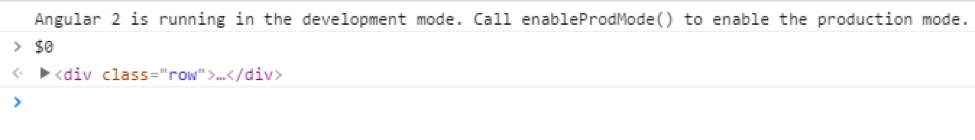
Many of the functions are available in development mode only (like ng.probe()), so make sure that your development mode is enabled (which is enabled by default).
ng.probe($0)
This allows you to inspect the scope of an element
We can get the reference of the ID by:
ng.probe($0).componentInstance
Now, we have the instance, we can interact with it, like changing the property, something like:
ng.probe($0).componentInstance.name = “text”;
It may not work for your project if the element does not have any such property. We need to invoke the change detector for the UI to reflect the changes:
ng.probe($0)._debugInfo._view.changeDetectorRef.detectChanges()
So, if you have chosen to change the property, make sure to use this function as well.
You can also use “debugger” breakpoint in your TypeScript code, so for example:
somefunction() {
debugger; // debug here
}
This will pause the application when this code is hit.
Via Augury
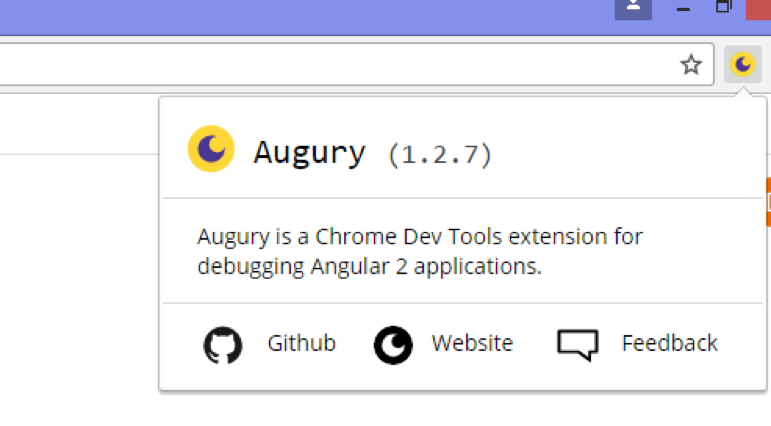
So you understand how debugging works in Google DevTools, let’s go into a next level. First, you need to install the Augury tools, which is as simple as going through the site (https://augury.angular.io/) and installing it using the Google Chrome.
Once it is installed, you will see the Augury icon on the right-top corner of your browser.
We know that AngularJS 2 uses the Component Tree as its structure, which means that the components are built on top of each other, making a kind of hierarchy or tree (wherein the root node and leaf node is present). With Augury, you can visualize and inspect the component tree, along with the properties of the component.
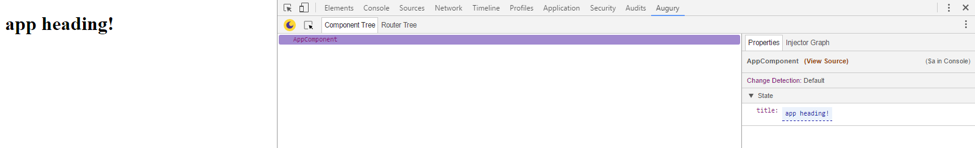
Using the previous project, click on the “Inspect Element” and then go to “Augury” tab. Therein, if you click on “AppComponent”, then you can see the “Properties” and “Injector Graph”.
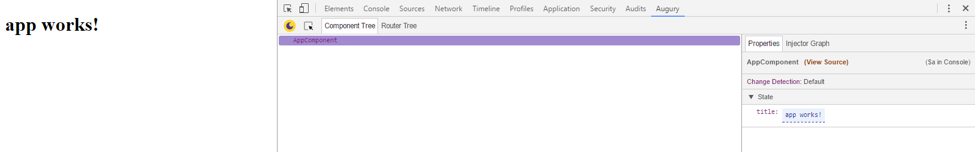
Let’s change the “title” property to something else in “Properties” tab. Once you enter the changes, you can see the results on the browser!
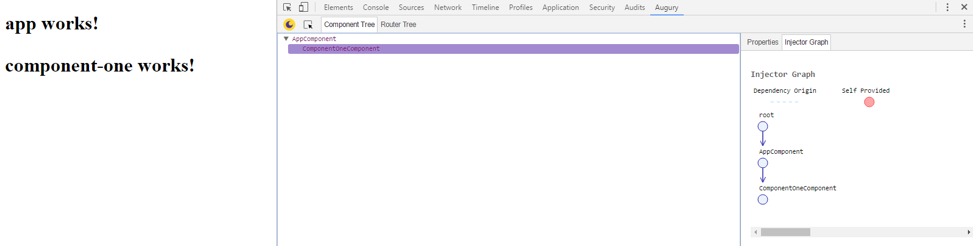
You can even see the visualization of the components through “Injector graph”, which allows you to see the dependencies that are injected, so you would see “root” component, and then within it “AppComponent” and so on (but these two components are all you would see in this project). If you click on new components in “Component Tree” then you will see it expanding in “Injector Graph”, but we don’t have much components here, so let’s add some new components:
$ng g component component-one
But this component is not usable right now. So let’s make some changes! Add the following to “app.component.ts”:
app.component.ts
<h1>
 {{title}}
 <app-component-one></app-component-one>
</h1>
Now if you do “ng serve”, then you will see the changes on the screen. Go to the Augury tab, and then you will see “ComponentOneComponent” as the part of our “AppComponent”. If you click on it, then you will see that “Injector Graph” extends on it.
When you have several routes, then you will see the route tree as well, but you wouldn’t see it in this project as there is no route at this moment. As this project would require us to create new routes, let’s use our previous Firebase project instead that already have some routes.
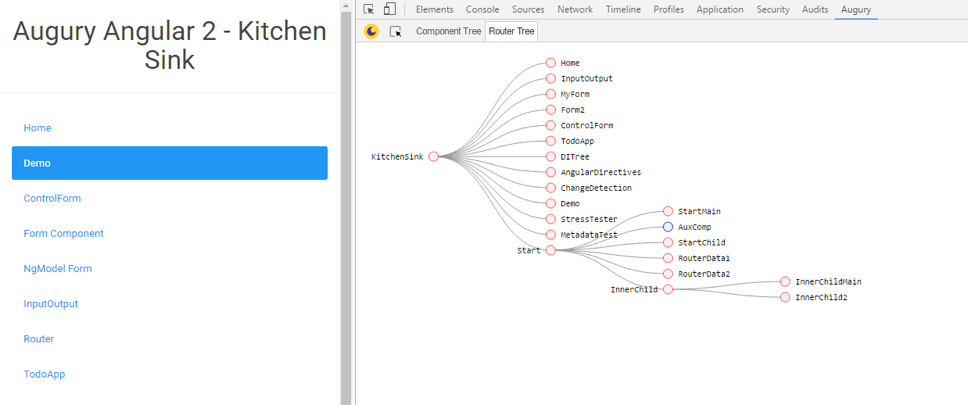
Do the “ng serve” in the “AngularJS2-Firebase” project directory, and then do “Inspect Element”, then you can see the Router Tree, but it doesn’t show the routes either even though we have routes defined in our application, why? Because routes need to be defined in a certain way as to show in Router Tree, so let’s first look at the Kitchen Sink example (https://augury.angular.io/demo) provided by the Augury itself. Assuming you are in the “Augury” screen, click “Router Tree” to see the cool tree of all the routers in the application.
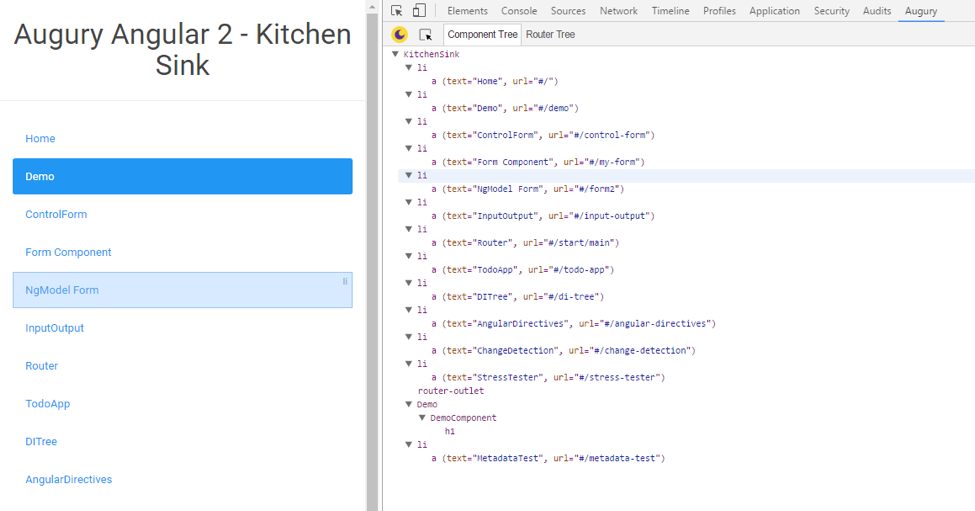
Going into the “Component Tree” will give you huge amount of components in the form of lists.
In order to view the Router Tree like the one above in your application (our previous FireBase project for example), you need to define router like the following:
constructor(private router: Router) {
}
This should be present in every classes that you want to make the Router PLUS the AppComponent. So, I added it in my components, and this is what it looks now:
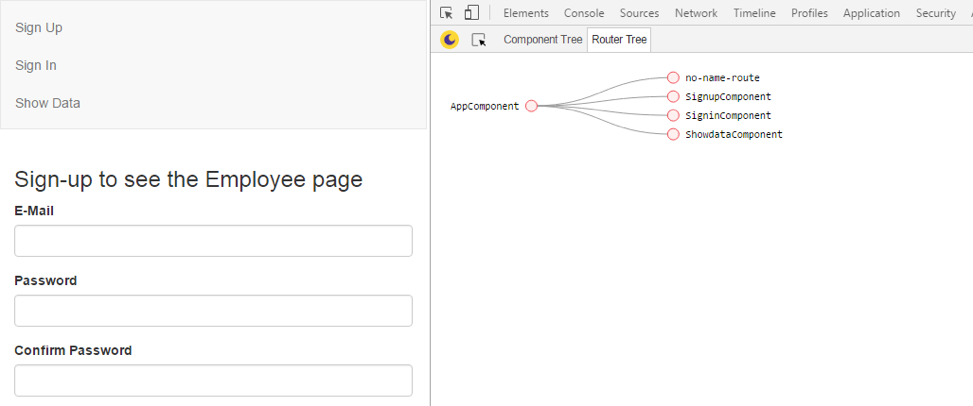
The “no-name-route” is the one that we set for redirecting, and therefore it’s not the router on its own.
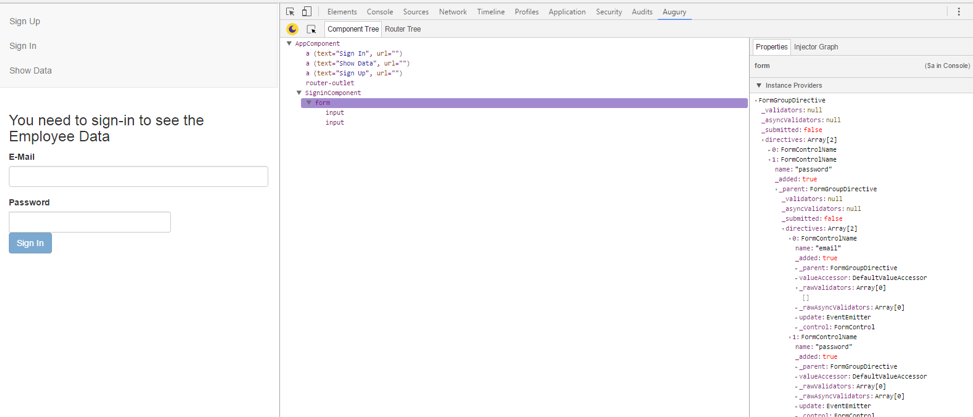
Augury also supports Forms, so you can set properties and values of everything included in the form.
You can also set breakpoints, including within source files when source maps are enabled (like I mentioned previously), and also Stepping, including using the buttons on the Chrome page.
Enabling Production Mode
At this moment, I like to highlight that when you are deploying the application, you can set your application to production mode, as that won’t show errors on the console or allow anyone to set the breakpoints. In your “main.ts”, add the “enableProdMode()” function:
import { enableProdMode } from '@angular/core';

enableProdMode();
Conclusion
Thus, so far, you can see that I have highlighted the debugging features in the AngularJS 2, so you can see how easy it is for you to do debugging right away. The ability of real-time debugging and the fact that values or properties can be changed in real-time for the UI to reflect the changes just added the tremendous amount of ease in AngularJS 2 development which will reflect in future development.
If you have any questions, please ask in the comment section below!
Recent Stories


Top DiscoverSDK Experts


Compare Products
Select up to three two products to compare by clicking on the compare icon () of each product.
{{compareToolModel.Error}}
{{CommentsModel.TotalCount}} Comments
Your Comment