
What is it all about?
Built on top of d3.js and stack.gl, plotly.js is a high-level, declarative charting library. plotly.js ships with 20 chart types, including 3D charts, statistical graphs, and SVG maps.
Key Features
Sophisticated chart types: plotly.js abstracts the types of statistical and scientific charts that you would find in packages like matplotlib, ggplot2, or MATLAB. Fully customizable: plotly.js charts are described declaratively as JSON objects. Every aspect of the charts, such as colors, grid lines, and the legend, has a corresponding set of JSON attributes. High performance: Most plotly graphs are drawn with SVG. This offers great compatibility across browsers and publication-quality vector image export. Unfortunately, there are inherent performance limitations with the number of SVG elements that you can draw in the DOM. Fully interactive: plotly.js charts are shipped with zoom, pan, hover, and click interactions. Click-and-drag to zoom into a region, double-click to autoscale, click on legend items to toggle traces. All of these events are also exposed in the API. Universal: By abstracting charts to a declarative JSON structure, plotly.js is used as a browser-based charting library for Python, R, MATLAB.
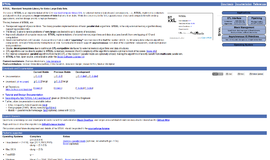
Pricing
Yearly
Monthly
Lifetime
Free
Freemium
Trial With Card
Trial No Card
By Quote
Description
free
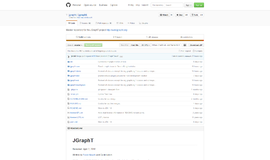


Top DiscoverSDK Experts

Jacques GOUIMENOU
I am currently Datascientist. Type of business or sector is: industries, health sector, finance, etc
Multimedia | Computer Vision and 25 more
View Profile

Esma Rucolli
Engineering.....my dream 💖
Hardware and RT | General Libraries and 87 more
View Profile
Interested in becoming a DiscoverSDK Expert? Learn more
X
Compare Products
Select up to three two products to compare by clicking on the compare icon () of each product.
{{compareToolModel.Error}}Now comparing:
{{product.ProductName | createSubstring:25}} X