Compare Products

|

|
Features * Profile all types of .NET applications - dotTrace helps you locate performance bottlenecks in a variety of .NET applications, including desktop applications, .NET Core, ASP.NET applications hosted on IIS or IIS Express web servers, Silverlight, WCF services, Windows services, Universal Windows Platform applications, and unit tests.
* Timeline and more profiling modes - Unlike "classic" performance profiling that only lets you measure method call execution time, timeline profiling reveals how calls are distributed in time.
By virtue of binding method call data to a timeline, this profiling mode goes beyond plainly detecting the slowest method: it allows diagnosing performance issues where the order of events matters, such as UI freezes, excessive garbage collection, uneven workload distribution, inefficient file I/O, and more. However, traditional profiling modes are still available in dotTrace. Sampling profiling is the easiest way to evaluate overall application performance, whereas tracing and line-by-line profiling modes are ideal when you need details on how a particular algorithm works inside.
* New profiling experience - You can slice and dice profiling data using filters, the call tree, or diagrams. By applying filters, you get a set of time intervals selected by a specific condition. The way it works is very similar to executing a query on a database to get exactly the data you need.
For example, to find out whether a UI freeze is caused by blocking garbage collection, you can ask dotTrace to select all time intervals on the main thread where the UI freeze occurred and blocking GC was performed. As complex as this may sound, this filter combination is in fact toggled in just two clicks.
* Deep Visual Studio Integration - dotTrace is deeply integrated with Visual Studio, helping you start profiling of the applications you currently develop without leaving the IDE. Even more, you can now view and analyze timeline profiling results right in Visual Studio. Found a hot spot call in the call tree? Instantly navigate to the method declaration! Visual Studio integration makes profiling experience virtually seamless as you no longer have to switch between the IDE and the profiler.
|
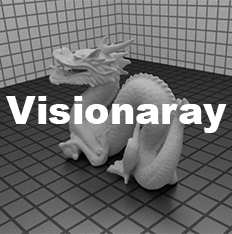
Features * Open Source: Visionaray is licensed under the flexible MIT license.
* Cross-platform: Intel CPUs, Nvidia GPUs, Xilinx FPGAs (work in progress). No duplicate code, all platforms targeted from the same C++ code.
* High flexibility through kernel- and scheduler-based architecture. Kernels describe what a ray does, schedulers describe how a ray is spawned.
* Built-in kernels: simple ray casting, "Whitted"-style ray tracing, "Kajiya"-style path tracing.
* Built-in schedulers: simple (scanline, single-threaded), tiled (multi-threaded), TBB, CUDA.
* User can write custom schedulers and kernels.
* Built-in performance primitives: SIMD short vector library, fast SBVH builder and traversal, texture support, physically based materials, etc.
* VR support: Visionaray comes with a plugin for the virtual reality renderer OpenCOVER.
|
LanguagesCPP CS VB.NET |
LanguagesCPP |
Source TypeOpen
|
Source TypeOpen
|
License TypeGPL |
License TypeMIT |
OS Type |
OS Type |
Pricing
|
Pricing
|
X
Compare Products
Select up to three two products to compare by clicking on the compare icon () of each product.
{{compareToolModel.Error}}Now comparing:
{{product.ProductName | createSubstring:25}} X