
Helps with:
Design Tools,GIS and Navigation,JavaScript
Source Type:
Open - Extra Fee
License Types:
Supported OS:
Languages:
Java Script
What is it all about?
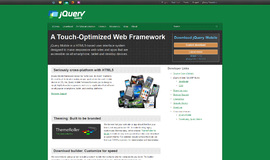
AnyMap JS Maps is an advanced JavaScript-HTML5 mapping library with the ever-expanding Map Collection, which makes you able to easily create interactive maps looking great on PCs, Macs, iPhones, iPads, Androids and other devices. Highly customizable.
Video & Images
Images
Key Features
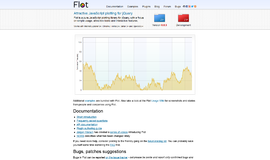
AnyMap JS is perfect for interactive dashboards and side-by-side reporting. You can use it to display sales by region, election results, weather forecast, population density, and any other geo-related data. AnyMap JS comes with our ready-to-use Map Collection which you can use at no additional cost. Maps are supplied in GeoJSON, which makes them flexible in working and editing. Custom maps can be created from any SHP map. AnyMap JS maps are fully compatible with other AnyChart JS Charts' HTML5 charting solutions - AnyChart JS (basic JavaScript charts), AnyStock JS (date/time JavaScript/HTML5 charts, e.g. financial and stock charts that visualize real-time data), and AnyGantt JS (JavaScript/HTML5 Gantt charts), and can be used both in a dashboard and as a standalone map visualization solution. Features of AnyMap JS: * Ever-expanding Map Collection with various country-specific and world maps. * Highly customizable. Special reaction to certain events can be assigned with the help of event listeners. * Wide variety of interactive options for your HTML5 maps, including tooltips, selection, hover, drill-down, etc. * Support for various types of maps including Choropleth Map, Point (Dot) Map, Bubble Map, Connector Map, and Seat Map for displaying data related to geographic areas in HTML5 based web projects. * Longitude/latitude support allows you to set coordinates (location) of Bubbles in Bubble JavaScript Charts in long/lat degrees. The API allows you to convert mouse coordinates to longitude and latitude (transform), and vice versa. * Changing scale, moving map, and creating custom UI (buttons, scrolls, etc.) via API. * Rich integration of keyboard and mouse controls. * Map projections.
Pricing
Yearly
Monthly
Lifetime
Free
Freemium
Trial With Card
Trial No Card
By Quote
Description
* Next Unicorn, Website, Internal, SaaS, Enterprise, OEM licenses.
* Free license for non-commercial/education/NPO
Find more at http://www.anychart.com/buy/
Plans
Yearly pricing starting at $49 for 2 Users

Top DiscoverSDK Experts


Meir Rabinovich
Real time and embedded developer
Hardware and RT | General Libraries and 5 more
View Profile


Interested in becoming a DiscoverSDK Expert? Learn more
X
Compare Products
Select up to three two products to compare by clicking on the compare icon () of each product.
{{compareToolModel.Error}}Now comparing:
{{product.ProductName | createSubstring:25}} X