
Helps with:
Memory
Source Type:
Closed
License Types:
Supported OS:
Languages:
C
CPP
Java
VB.NET
Java Script
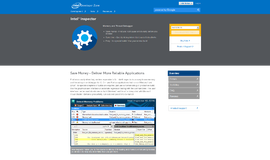
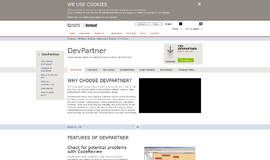
What is it all about?
AQtime Pro is a software performance exploration suite to help developers track down memory profiling issues, CPU and other I/O bottlenecks, perform comprehensive code coverage analysis, and perform fault simulation. It includes profiling and coverage support for Java, Microsoft .NET profiling, C/C++, Delphi, JScript, VBScript, Silverlight, and other programming frameworks.
Key Features
* Measure App Health Accuratel - From specification to final delivery, professional developers constantly aim to build applications that are robust, clean-running and clear of hidden bottlenecks, resource wastage and performance limitations. AQtime is the tool that tells you at any moment during development how your application is doing. Using its comprehensive suite of profilers, developers can measure the health of their applications with unrivaled accuracy. * Application Performance Profiling - Find slow methods and lines of code fast using AQtime’s powerful application performance analysis. Guesswork is gone. * Memory Profiling - Track down memory leaks, resource leaks and optimize memory usage in native and .NET applications. The memory allocation debugger shows exactly where the code is leaking memory, so you can fix issues quickly. * Code Coverage Analysis - Measure code coverage to confirm what has been tested and to find untested or unused code, by source files, classes, methods and lines of code. See whether the current tests are sufficient or additional tests are needed. * Runtime Fault Injection - Inject various faults into your running applications to test fault tolerance and graceful recovery from failures. No source code changes are needed! * Applications & Technologies - With application runtime analysis for C/ C++, Delphi, .NET, ASP.NET, Silverlight, Java and scripts, you can profile both native and managed modules, even simultaneously. * Delphi Profiling - AQtime Pro provides top-to-bottom Delphi application analysis, including performance profiling, memory and resource profiling, code coverage, unused unit detection, code metrics and exception tracing. * Profiling in Microsoft Visual Studio - Work smarter and optimize your code in Microsoft Visual Studio. Find performance issues, memory and resource leaks right from your IDE. * Profiling in RAD Studio - SmartBear's performance and memory profiler AQtime is available as an extension to Embarcadero RAD Studio, allowing developers to analyze and optimize their applications without leaving the IDE. * Reports and Analysis - Get deep insight into your application performance, memory usage and code coverage using detailed profiling reports with line-level metrics. Sort, filter and compare profiling data to prioritize the found bottlenecks.
Pricing
Yearly
Monthly
Lifetime
Free
Freemium
Trial With Card
Trial No Card
By Quote
Description
stat from €539


Top DiscoverSDK Experts

Billy Joel Ranario
Full Stack Web Developer and Article Writer
GUI | Data Handling and 31 more
View Profile

Esma Rucolli
Engineering.....my dream 💖
Hardware and RT | General Libraries and 87 more
View Profile
Interested in becoming a DiscoverSDK Expert? Learn more
X
Compare Products
Select up to three two products to compare by clicking on the compare icon () of each product.
{{compareToolModel.Error}}Now comparing:
{{product.ProductName | createSubstring:25}} X